MultiWAN
Version: ENOS v1.7.3R
MultiWAN allows your router to manage and use multiple internet uplinks at the same time. With the optimized graphical interface, you can easily aggregate bandwidth through load balancing to improve throughput, or configure primary/backup failover to keep the network online when an uplink fails.
1. Status: Global Network Monitoring
The Status page is the dashboard for all network interfaces on the device. It shows which networks are online, how traffic is distributed, and the underlying routing information.
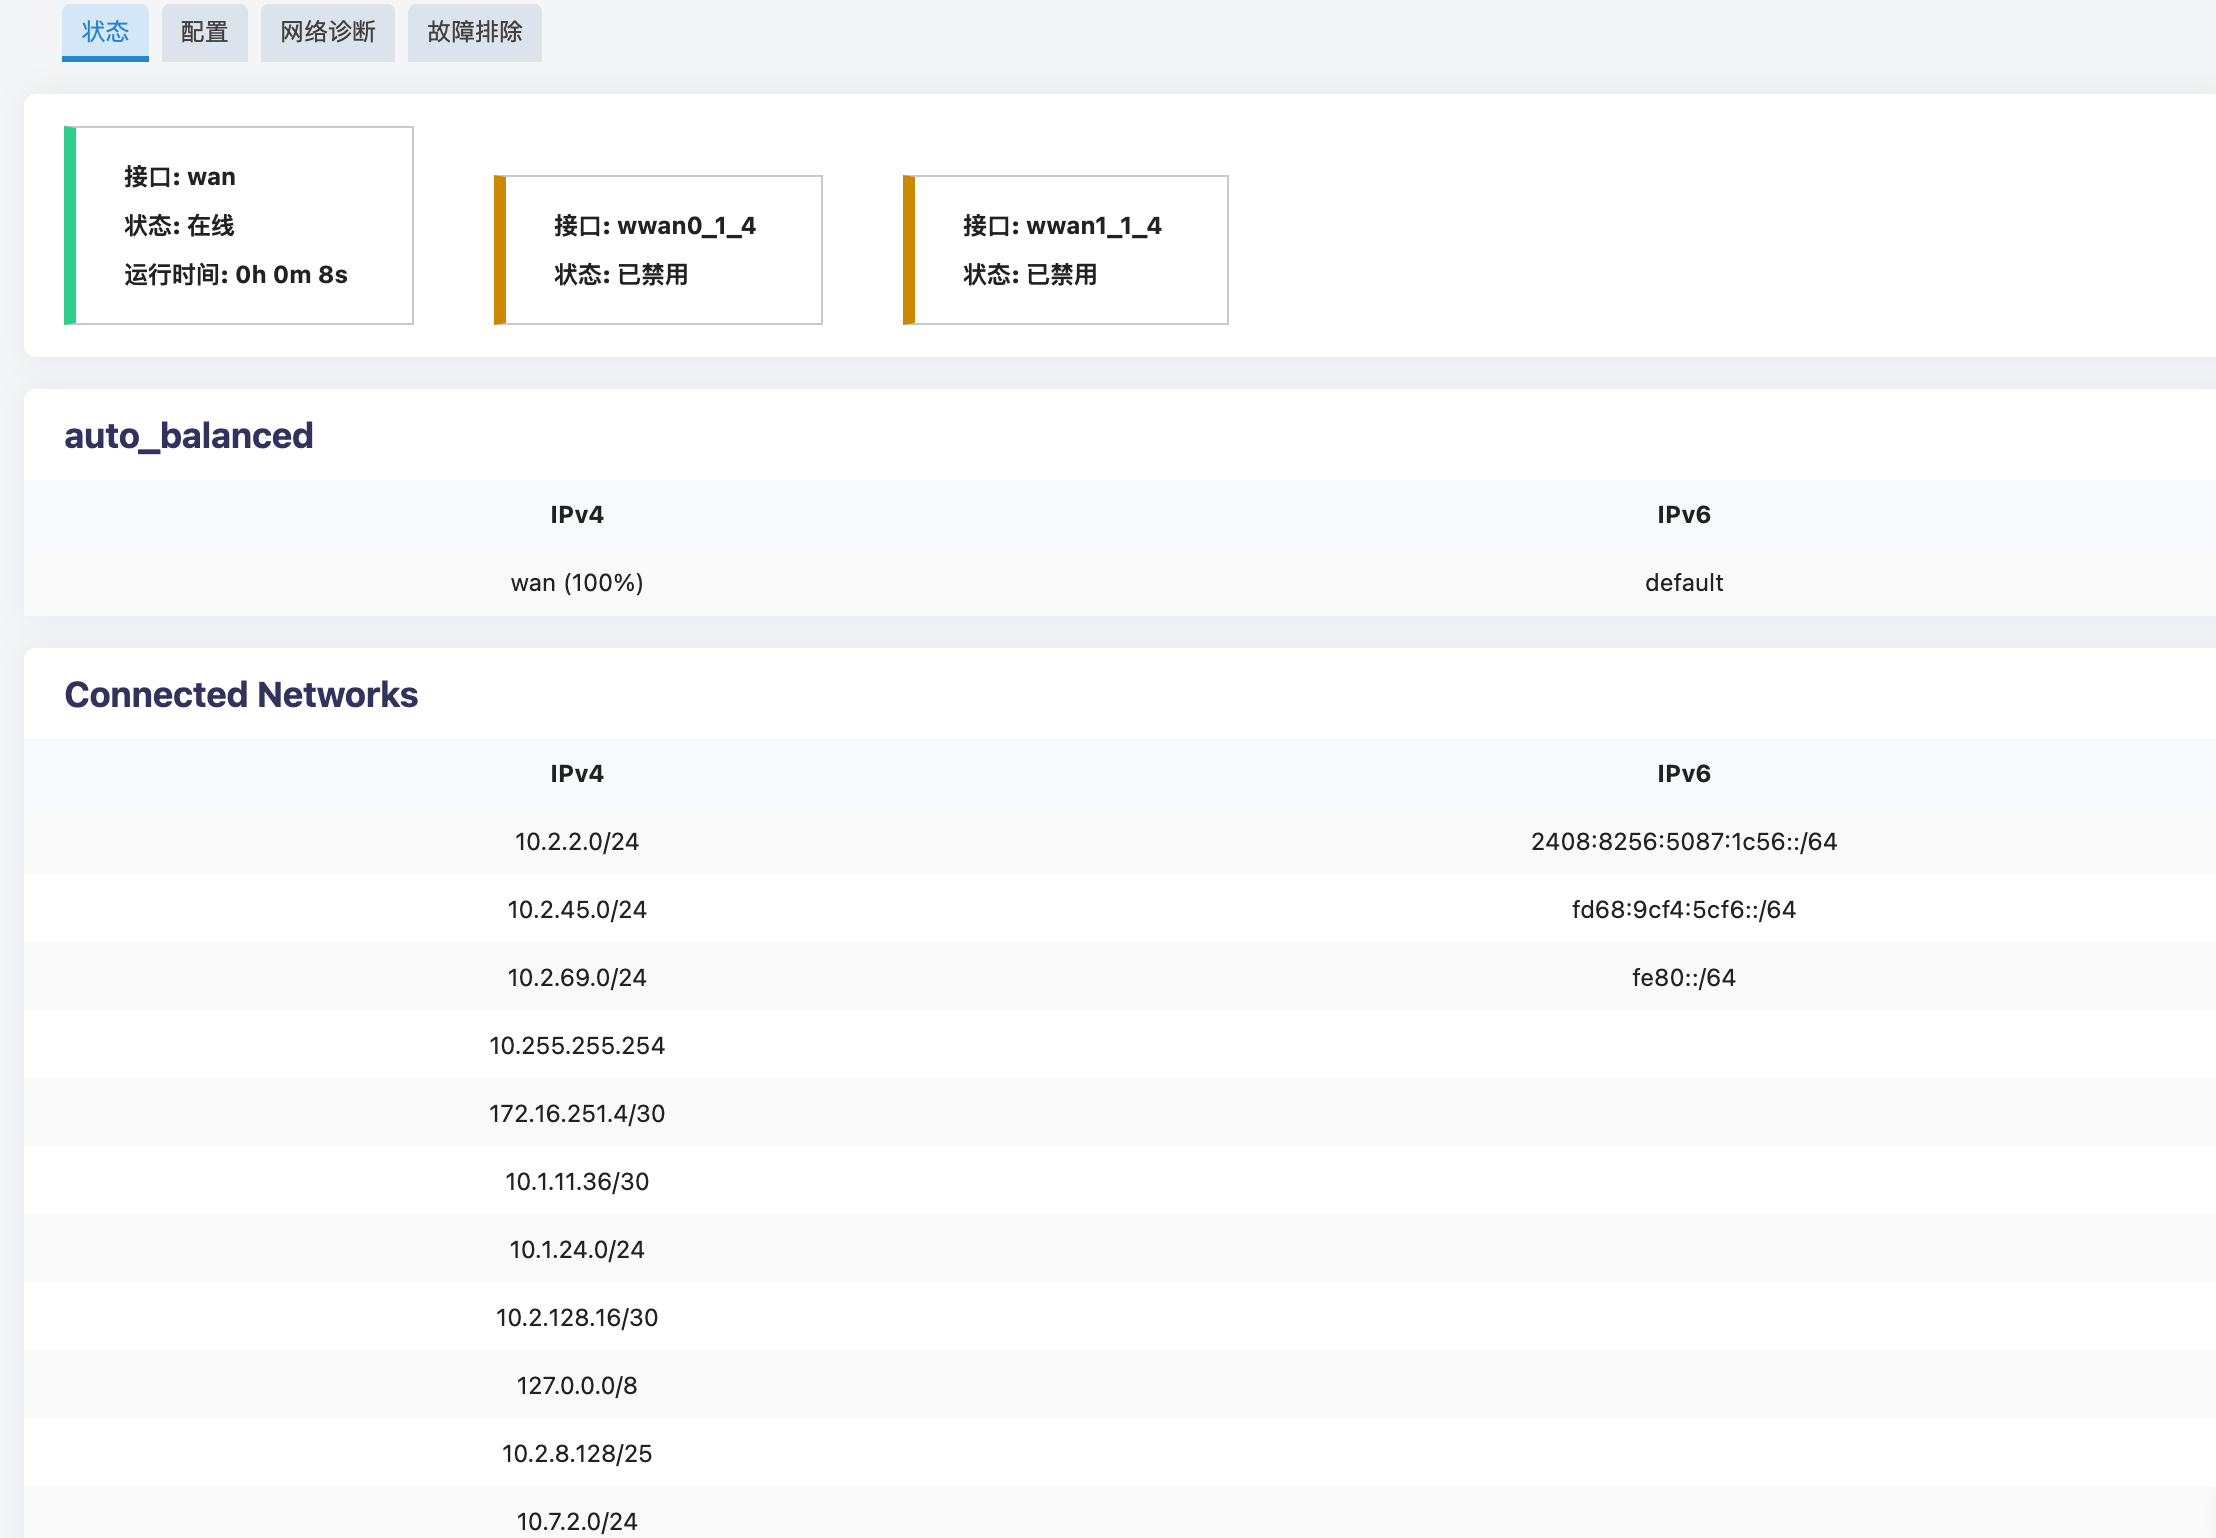
- Interface status cards (top): Shows the current state of each physical or virtual interface, such as
wanorwwan0_1_4, including whether it is online or disabled and how long it has been running. - auto_balanced: Shows the current IPv4 and IPv6 traffic distribution across interfaces. For example,
wan (100%)means all current traffic is routed through thewaninterface. - Connected Networks: Lists all IPv4 and IPv6 subnets and routing tables currently detected by the device, which helps advanced users check for network segment conflicts.
2. Configuration: Core Policies and Link Tracking
The Configuration page is the control center for MultiWAN. Here you can define the global routing policy for multiple WAN uplinks and configure the underlying health tracking mechanism so traffic is distributed or switched as expected.
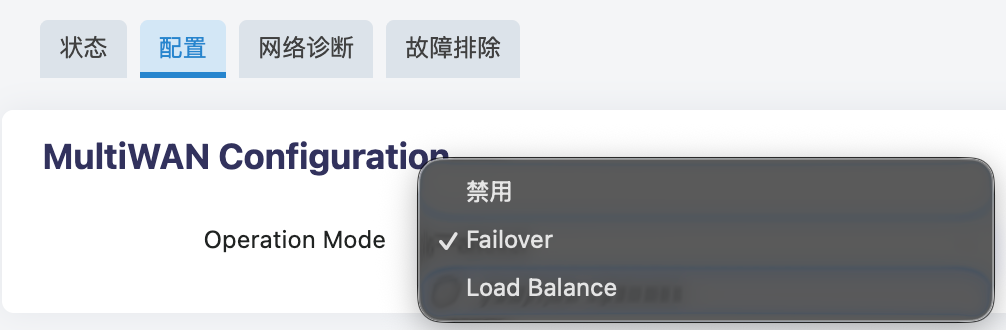
2.1 Operation Mode Comparison
The system provides two traffic scheduling modes. Choose the mode that matches your network topology and service requirements.
| Operation mode | How it works | Core scheduling parameter | Recommended scenarios |
|---|---|---|---|
| Failover | Uses a primary/backup routing model. All traffic is carried by the highest-priority primary uplink by default. When the system detects that the primary uplink is down, traffic automatically switches to the backup uplink. | Priority | Scenarios with strict connectivity requirements, especially when primary and backup links have different bandwidth or billing models, such as fiber as primary and 5G/4G as backup. |
| Load Balance | Uses concurrent routing. The system combines multiple online uplinks into one resource pool and dynamically distributes new connections across them according to the configured weight ratio. | Weight | Scenarios with multiple broadband uplinks where the goal is to maximize total physical bandwidth and improve overall throughput. |
2.2 Interfaces and Link Status Tracking
Regardless of the selected operation mode, the system relies on Tracking to continuously evaluate the health of each physical or virtual interface.
Based on the Operation Mode selected above, the interface list dynamically changes the available configuration items and supports convenient UI operations.
- Priority ordering in Failover mode: The right side of the list shows the takeover priority for each interface. The value
1is the highest priority.- Quick action: You do not need to open the edit details. Hold the drag handle on the right side of the row and drag the row up or down to quickly adjust the primary/backup takeover order.
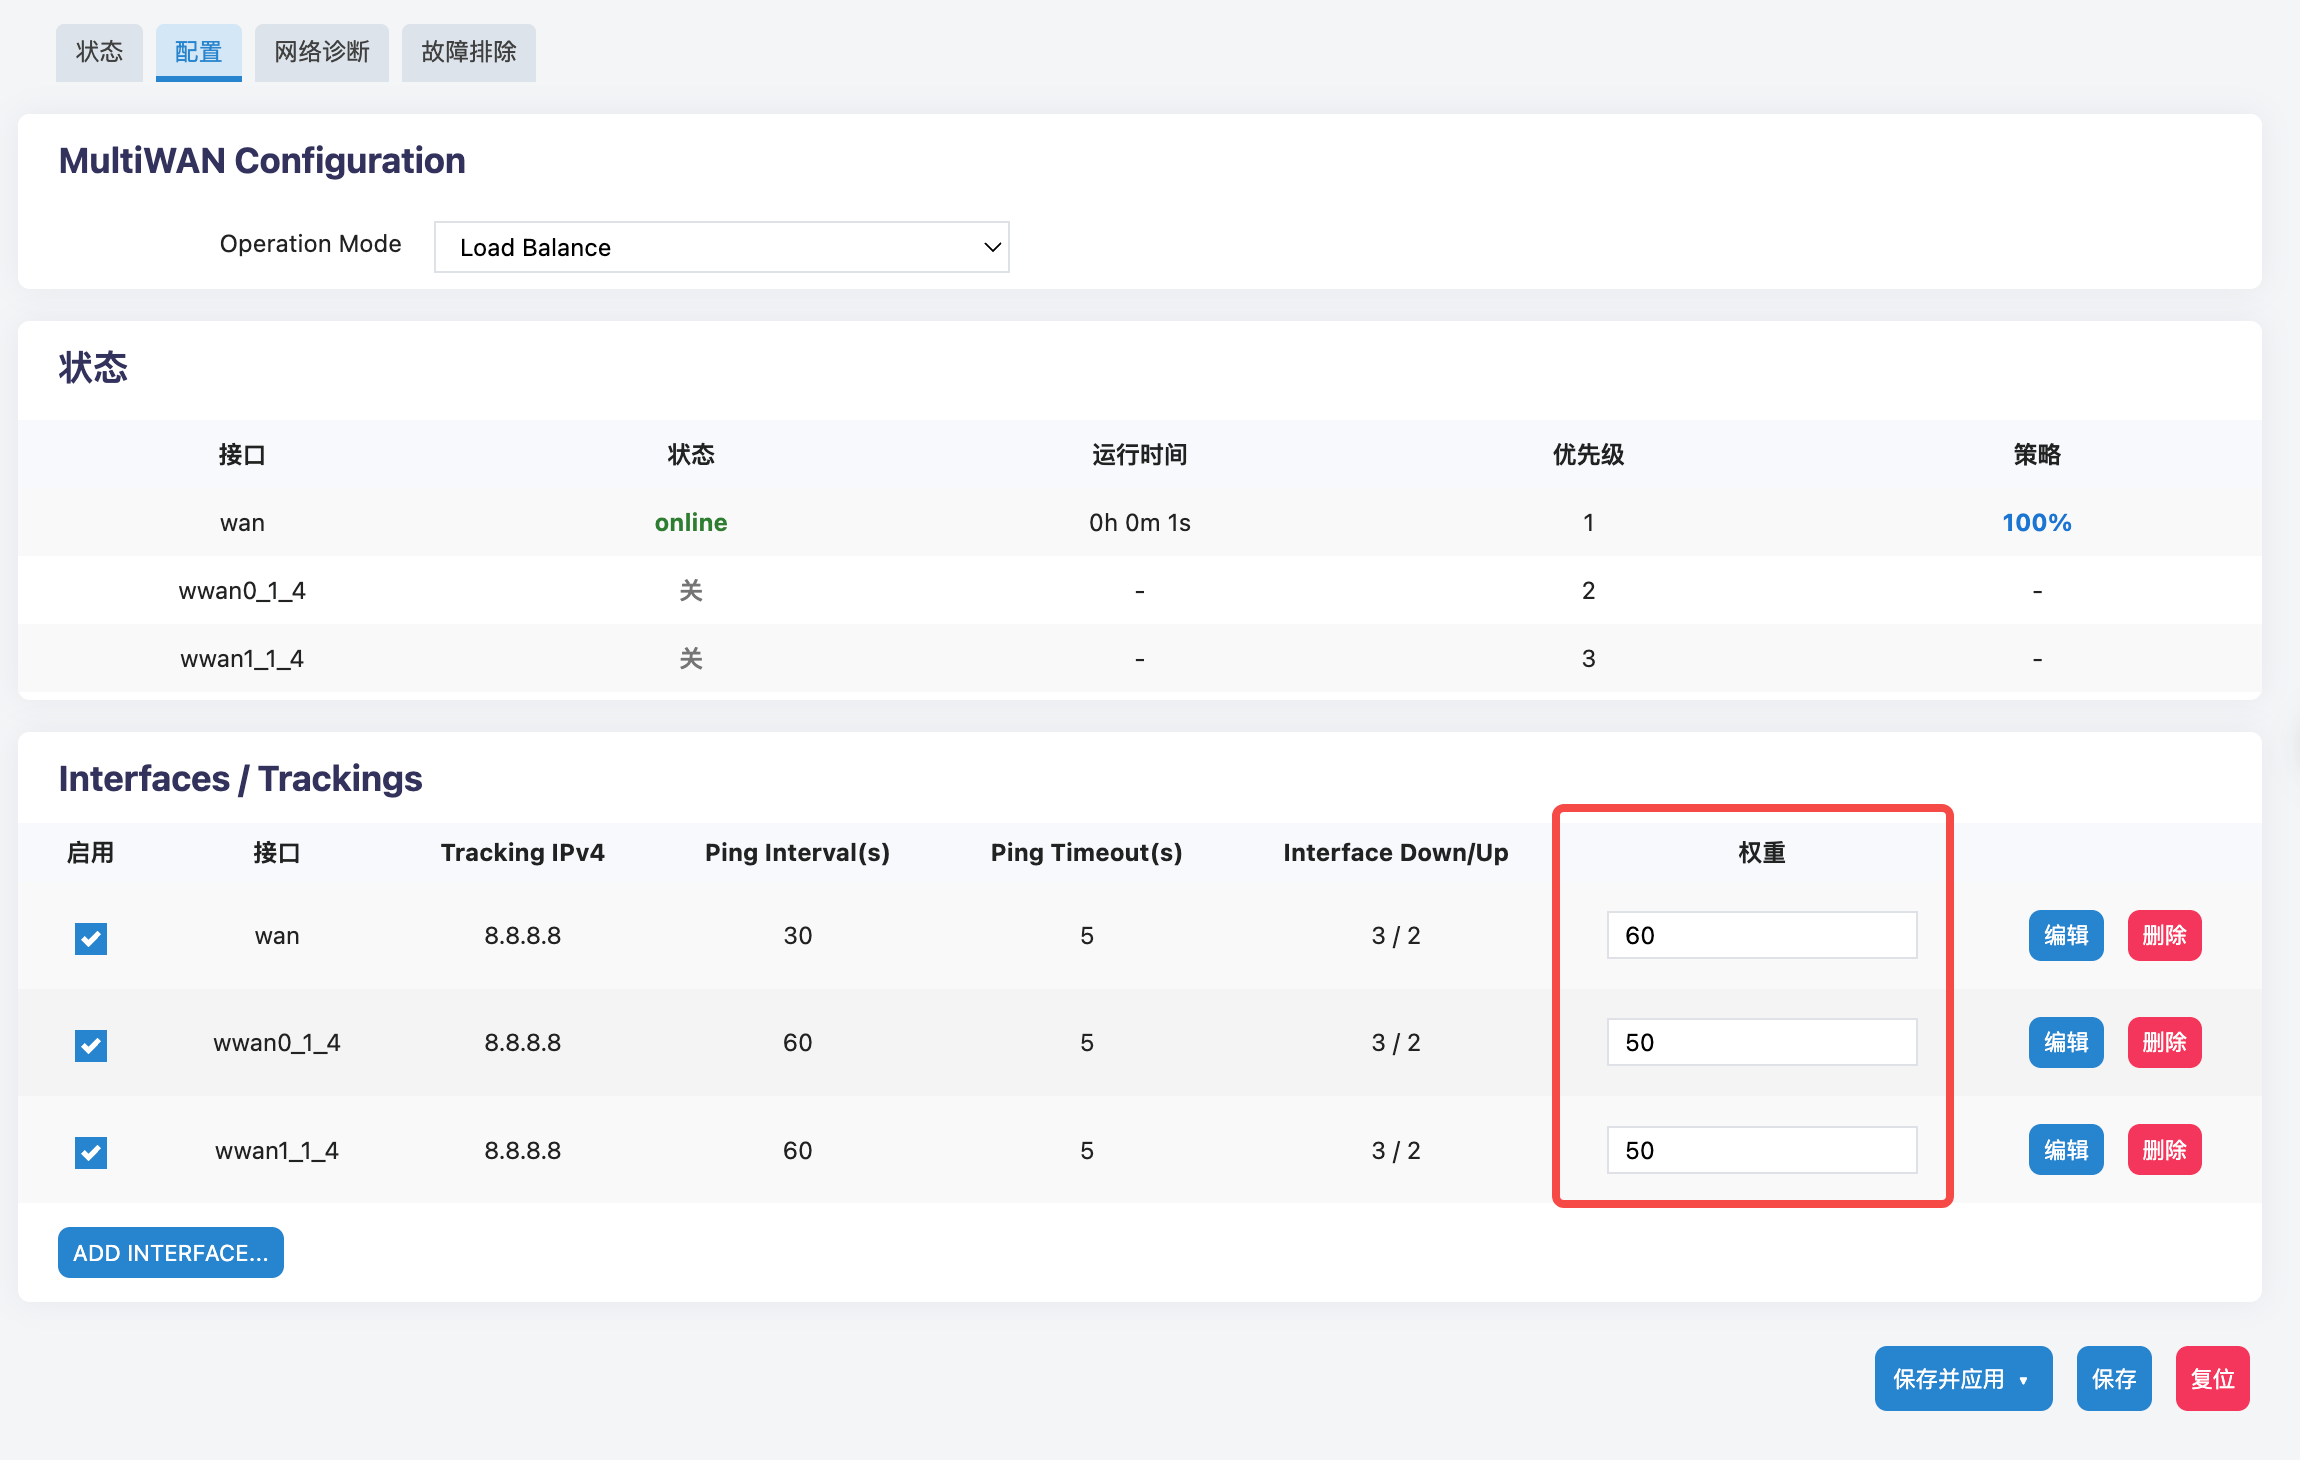
- Weight allocation in Load Balance mode: The right side of the list shows the traffic distribution weight for each interface.
- Quick action: Enter an integer from
1to100directly in the input box. The system distributes traffic according to that ratio. For example, if two uplinks are set to60and40, traffic is distributed at a 6:4 ratio.
- Quick action: Enter an integer from
Advanced Tracking Parameters
To customize how sensitive the system is when determining whether a link is up or down, click the Edit button on the right side of the corresponding interface and configure the detailed ICMP probe parameters in the dialog.
- Enable: Enables the interface so it is managed by the MultiWAN policy.
- Tracking IP/Host: The target IP address used for connectivity testing. A highly available public DNS address, such as
8.8.8.8, is recommended. Multiple IP addresses can be added to reduce false positives. - Test Interval(s): The interval, in seconds, between two network probes.
- Ping Timeout(s): The maximum time, in seconds, to wait for a response from the target IP. If no response is received before the timeout, the probe is treated as failed.
- Failures before Down: The number of consecutive failed probes required before the system marks the link as offline and triggers route switching. For example, setting this value to
3helps filter out brief network jitter. - Successes before Up: After a link is offline, the number of consecutive successful probes required before the system marks the link as restored and adds it back to the routing pool.
Configuration reminder: After changing priority order, weight values, or tracking parameters, click Save & Apply in the lower-right corner of the page to reload the network policy and apply the configuration.
3. Network Diagnostics
When an uplink behaves abnormally, you can run targeted tests directly on the Network Diagnostics page without logging in through SSH.
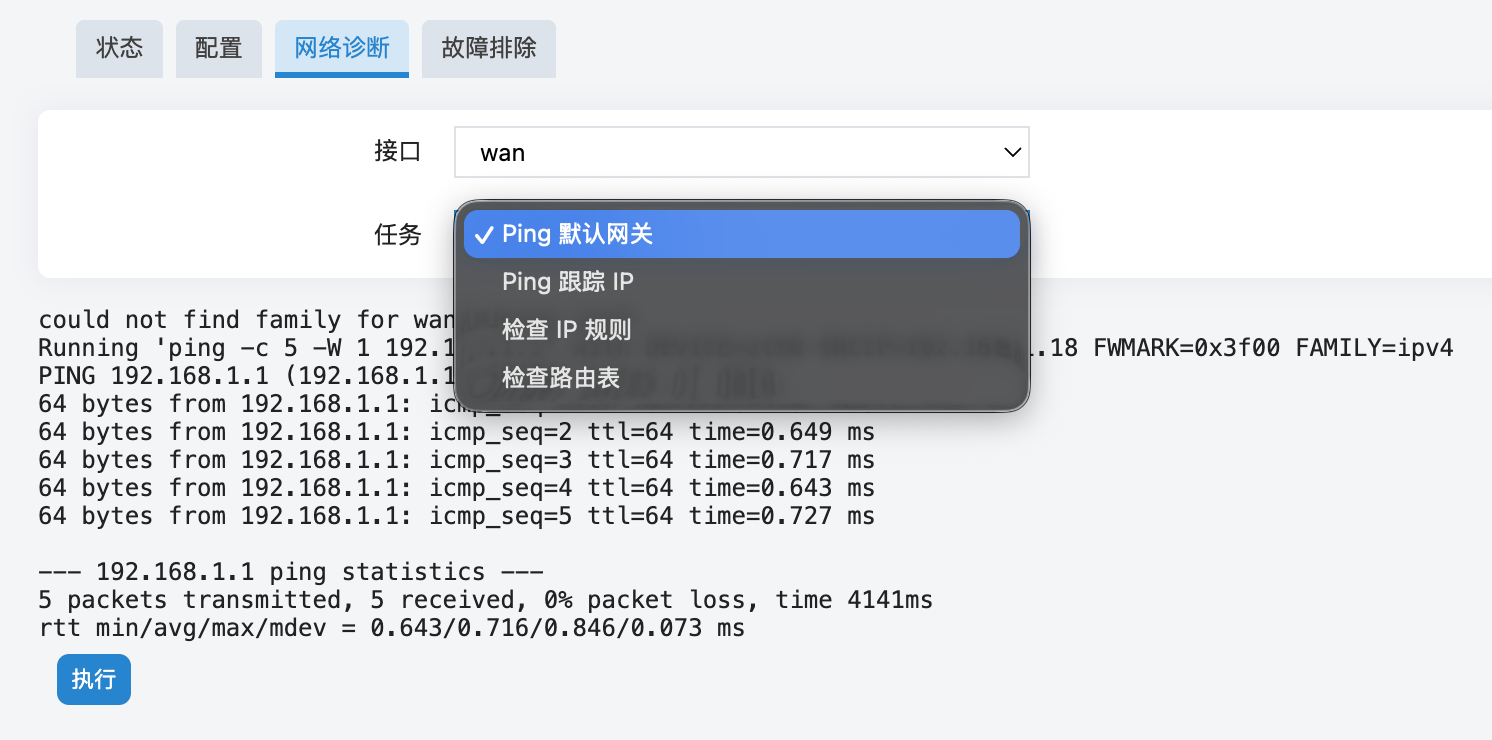
Interface selection: Forces test packets to be sent through a specific physical interface, such as
wanorwwan0_1_4. This is useful when troubleshooting a single uplink.Task selection:
- Ping default gateway / Ping tracking IP: Quickly tests connectivity from the selected uplink to the gateway or an external target, such as
8.8.8.8. - Check IP rules / Check routing table: Displays the underlying policy routing data for advanced troubleshooting.
- Ping default gateway / Ping tracking IP: Quickly tests connectivity from the selected uplink to the gateway or an external target, such as
4. Troubleshooting
The Troubleshooting page is designed as a diagnostic snapshot for advanced network troubleshooting and technical support. When you encounter complex routing conflicts, policies that do not switch as expected, or issues that require support assistance, this page generates a system-level snapshot of the underlying network state.
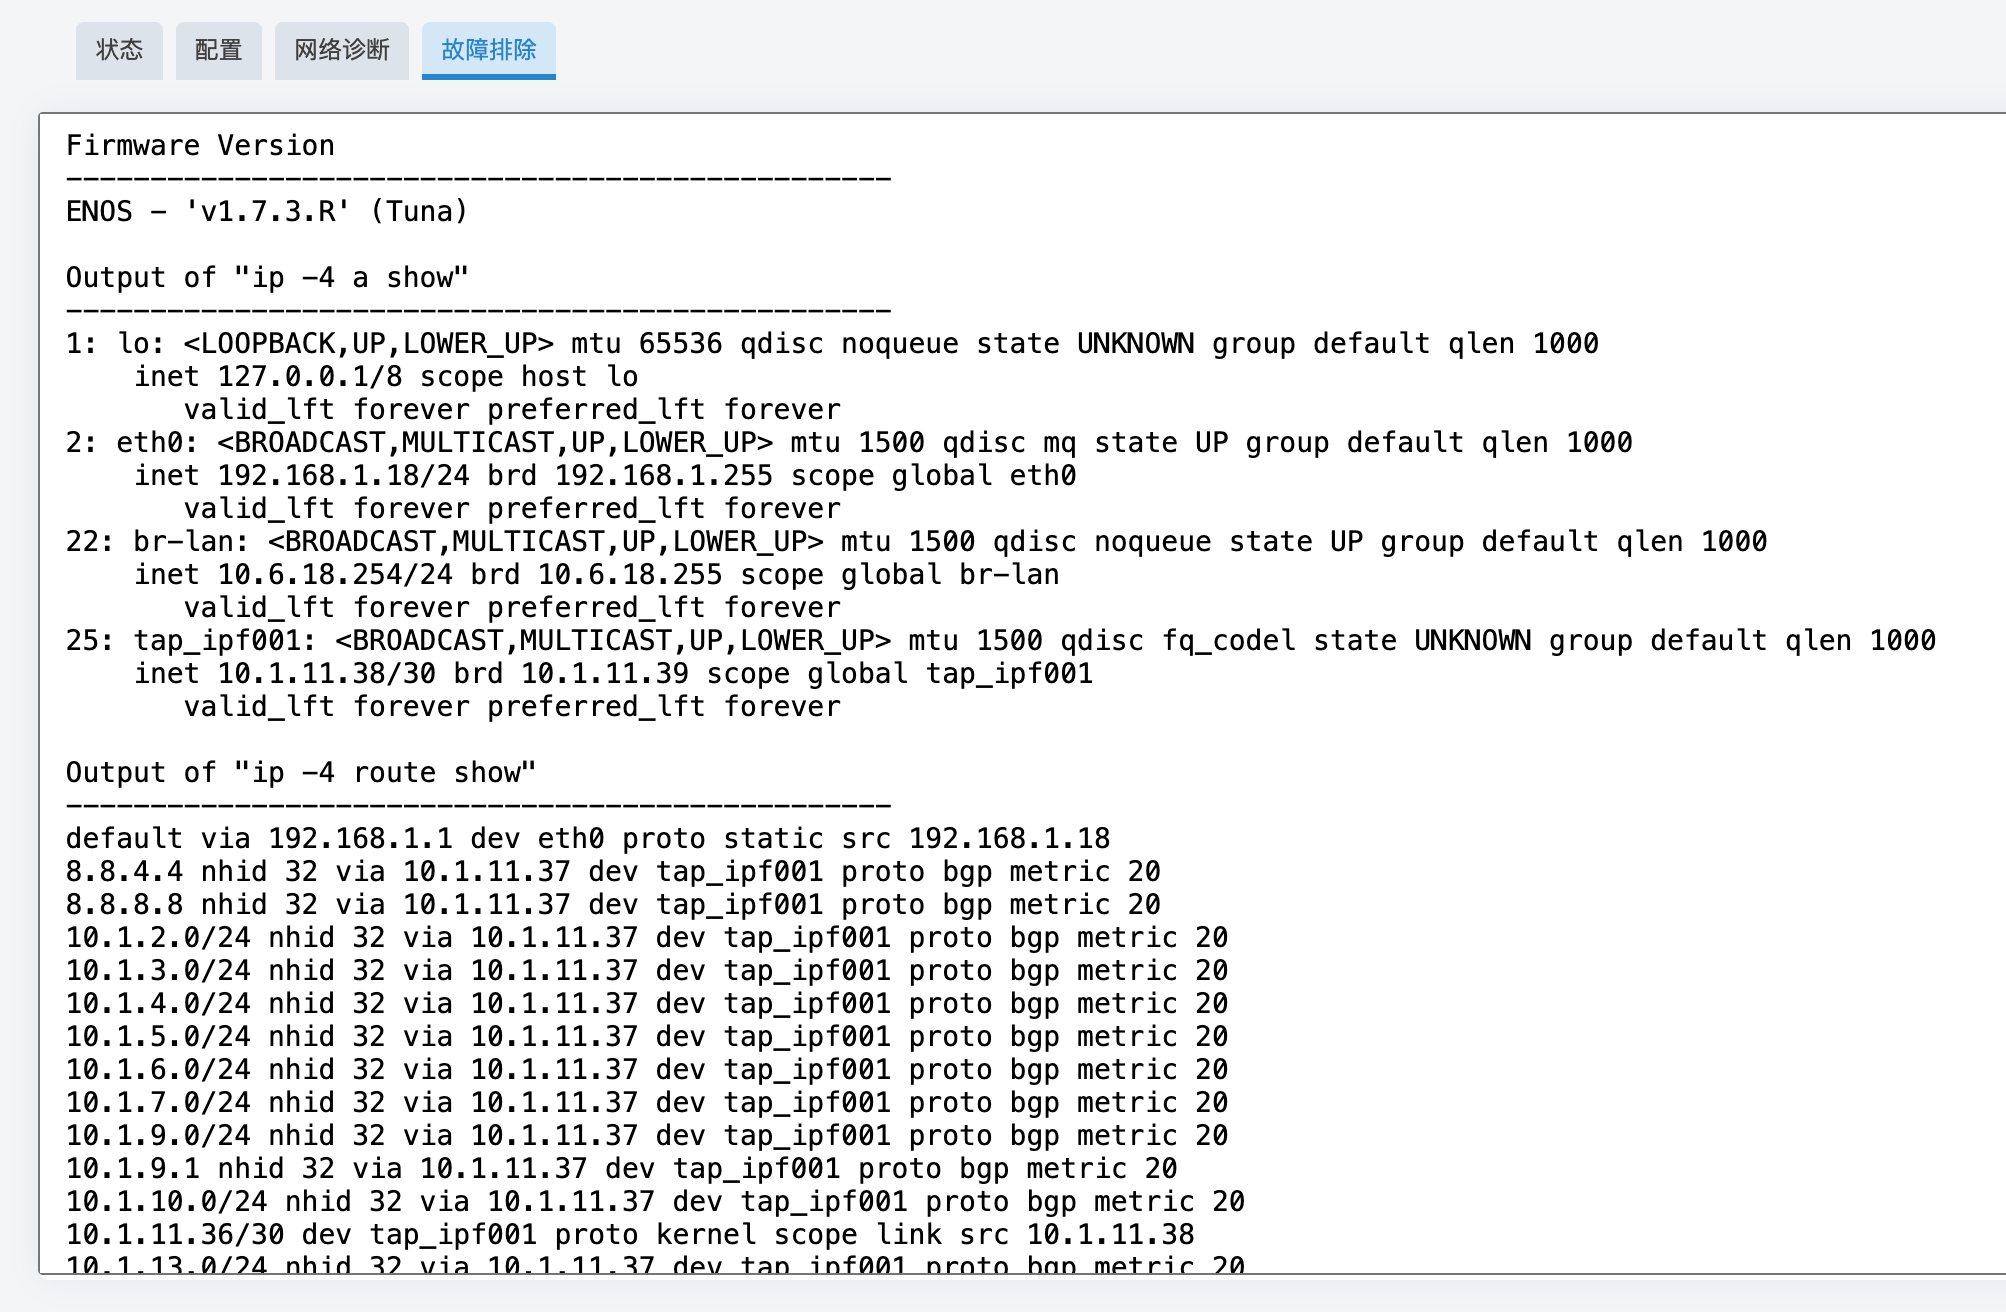
In addition to the system firmware version and global IP assignment information, this page automatically runs and prints the three core data sets that MultiWAN depends on.
- ip -4 rule show (policy routing rules): Shows the system IPv4 routing policy database (RPDB). This indicates how the system uses firewall marks (
fwmark) to direct specific network traffic into different MultiWAN-specific routing tables. - ip -4 route list table 1-250 (MultiWAN-specific routing tables): Shows the dedicated routing tables created by MultiWAN for each physical interface, separate from the system default main routing table. This helps advanced users verify whether the default gateway and subnet configuration of each WAN uplink are correctly isolated and applied.
- iptables -t mangle -w -L -v -n (firewall mangle table rules): Shows the traffic marking rules in the underlying firewall. MultiWAN works by using custom chains such as
mwan3_preto mark ingress and egress traffic, then handing that traffic to policy routing. This output helps determine whether traffic is correctly identified, intercepted, or distributed.
4.1 Best Practices
For users who are not network engineers, you do not need to understand every line of this command output. When a difficult network issue occurs, copy all text from this page and send it to your technical support team. They can use it to quickly determine whether the problem is caused by interface configuration errors, routing table conflicts, or firewall rule failures.