Introduction
Log management is a core function of network device operation and maintenance, which records the device's operating status, error information, security events, and performance data. By properly configuring the logging system, you can:
- Real-time monitoring of device operating status
- Quickly identify the root cause of network failures
- Track security events and abnormal behaviors
- Analyze performance trends and bottlenecks
- Meet compliance audit requirements
Configuration steps
Basic Parameter Configuration
System log buffer size (System Log Buffer)
- Function: Defines the cacheable log capacity in device memory.
- Recommended value: 2048–4096 kiB in the production environment; it can be temporarily increased to 8192 kiB or higher during the troubleshooting phase.
- Note: A buffer that is too small may cause historical logs to be quickly overwritten; one that is too large may consume excessive memory resources.
Write system log to file
- Default: Off.
- Activation condition: When short-term debugging is required or evidence needs to be retained on the local machine.
- Risk: Occupies storage space, may affect performance and flash memory lifespan.
- Requirement: Turn off this option after debugging is completed.
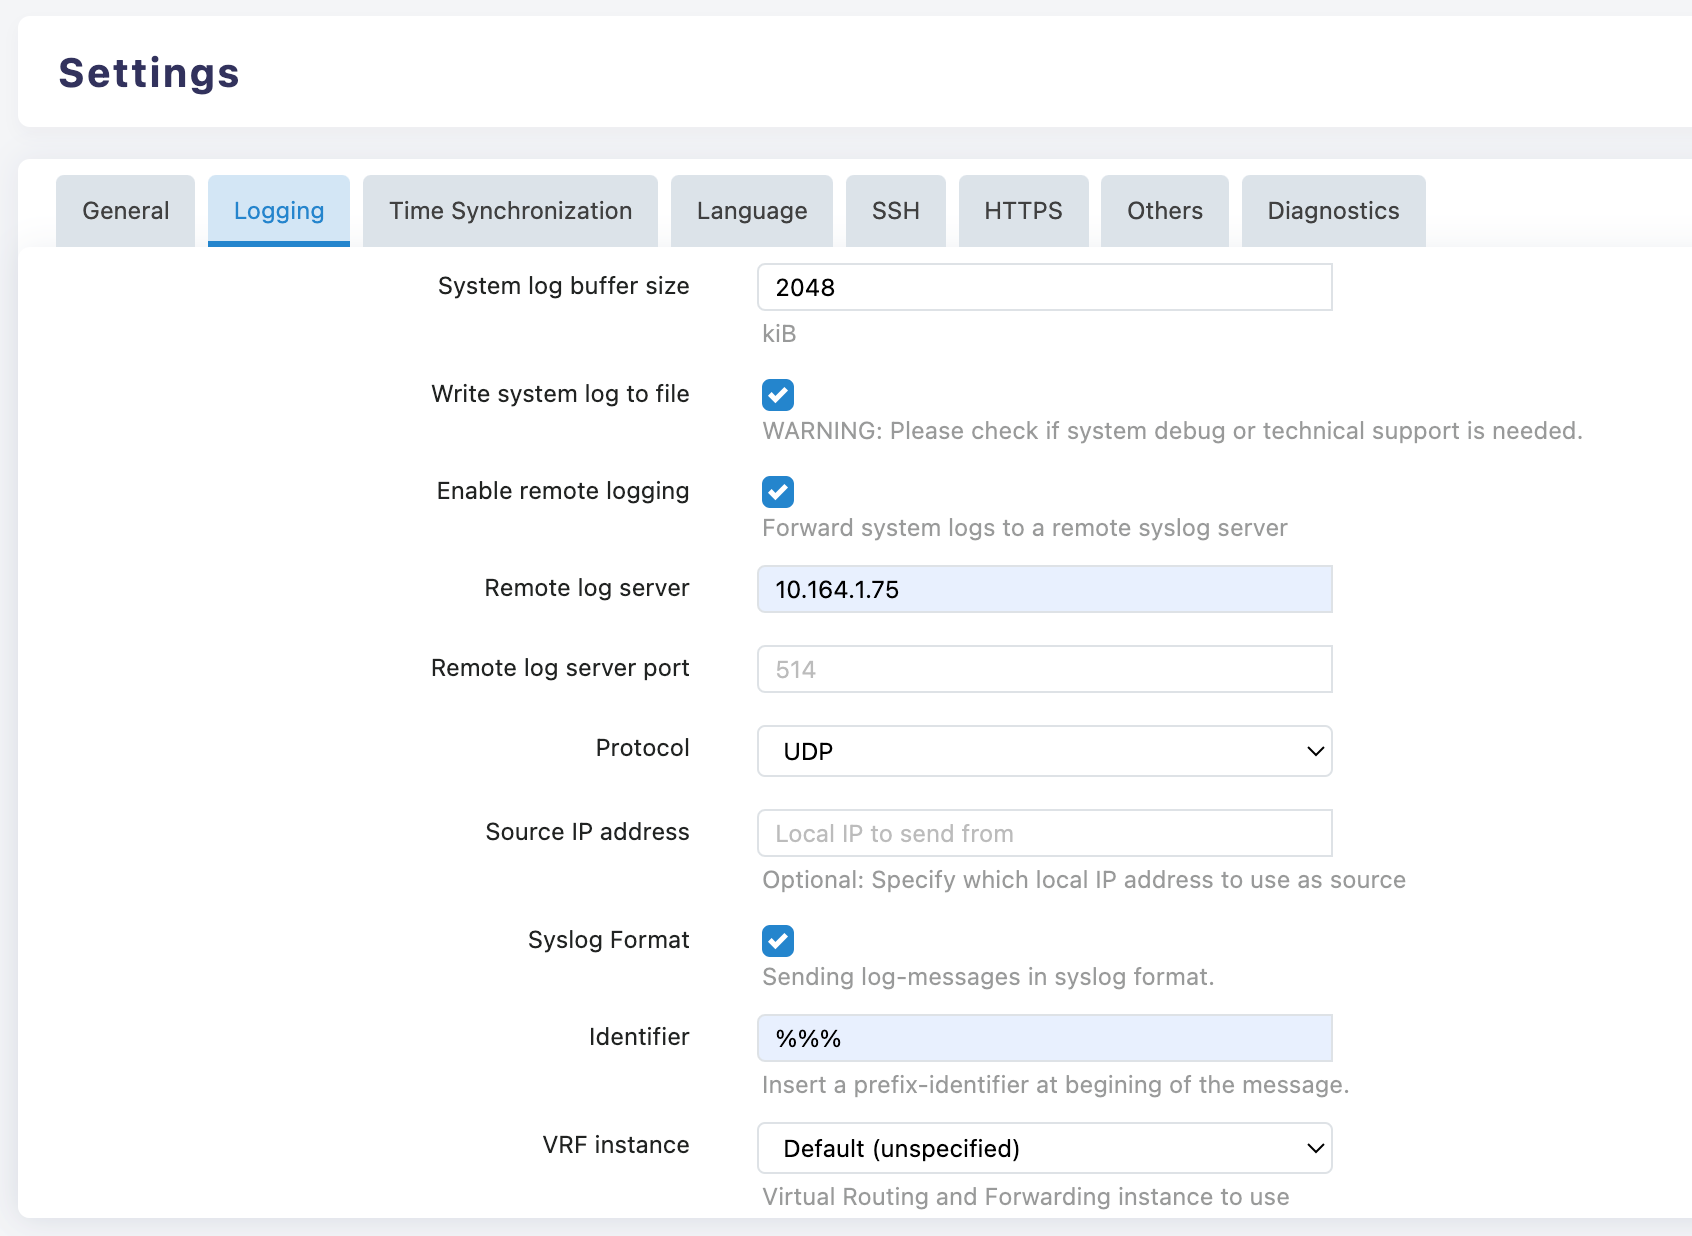
Remote Log Configuration (strongly recommended to enable)
Enable remote logging (Enable Remote Logging): Checked.
Remote log server (server address): Enter an IPv4 address or FQDN, such as
192.168.10.50orsyslog.company.com.Server port (Port):
- Default: 514 (UDP).
- Optional: 6514 (TLS/Encryption), 1514 (Custom), subject to server configuration.
Protocol(Protocol):
- UDP: lightweight, commonly used, but does not guarantee message delivery.
- TCP: Reliable transmission, suitable for auditing and critical systems; ensure server ports are open.
Source IP address:
- Usage: Specify the local address for log sending.
- Requirement: Select the management interface IP in multi-interface/multi-VRF devices for policy control and identification.
Syslog Format (Standard Format): Enabled, ensuring that logs follow the RFC format for easy parsing and compatibility.
Identifier:
- Requirement: Adopt the "site-device name-purpose" structure, such as BJ-Edge1-WAN, to facilitate remote retrieval and archiving.
VRF instance (VRF Instance):
- Selection: Select the correct instance in a VRF-enabled network; keep the default when VRF is not used.
Log Viewing and Understanding
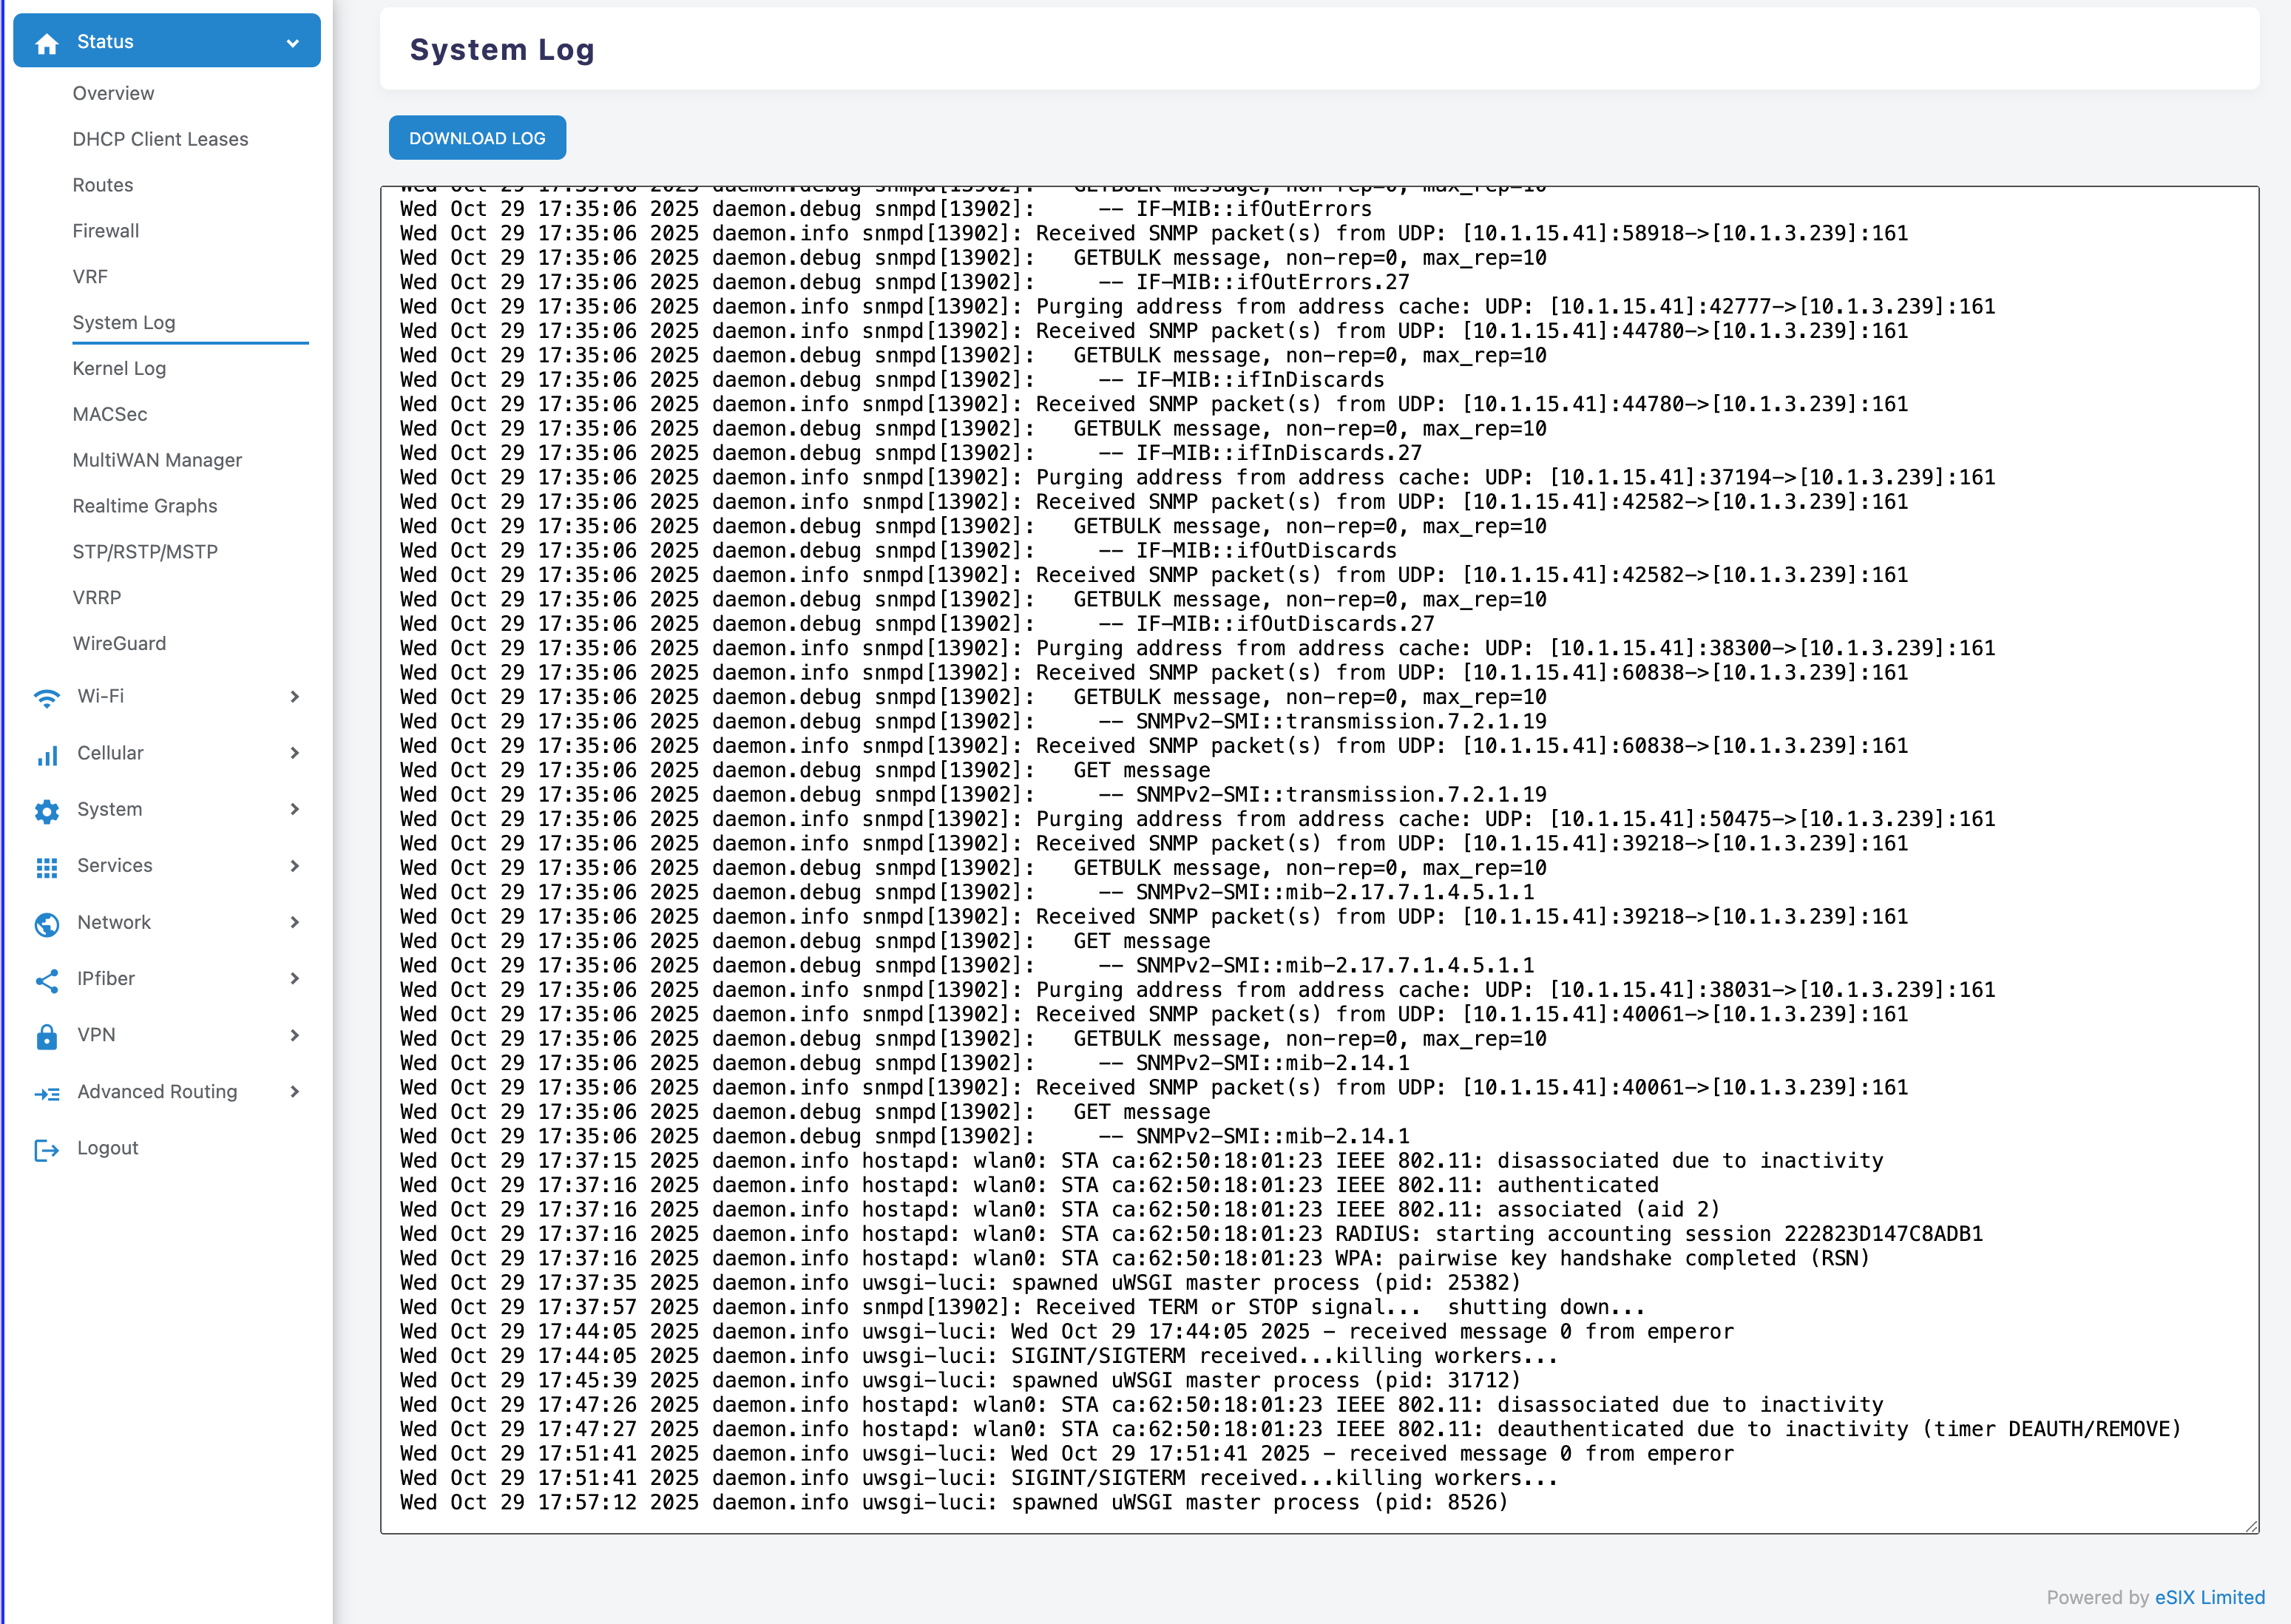
Enter the viewing page
- Path: Status > System Log.
- Function: Real-time scrolling view, supports "DOWNLOAD LOG" to export the complete log.
Basic Structure of Logs
- Timestamp: The time when the event occurred.
- Level and Source: such as kern.info, daemon.notice, indicating the module and importance.
- Process information: process name and PID, such as kernel, netifd, zebra, bgpd.
- Message content: Specific event description.
Common Log Types and Meanings
Interface and Kernel Events (kernel, netifd)
- Example: IPv6: ADDRCONF(NETDEV_CHANGE): wlan1: link becomes ready;Network device 'wlan1' link is up。
- Meaning: Interface link state change, forwarding readiness, online/offline.
Routing and Forwarding Processes (zebra, bgpd, ospfd, isisd, pimd, ldpd, bfdd, watchfrr)
- Example: watchfrr: bgpd state -> up : connect succeeded;zebra: Configuration Read in Took: 00:00:00。
- Meaning: Protocol component loading configuration, session establishment or failure, and control plane state changes.
Configuration read and file exceptions (mgmtd, etc.)
- Example: vty_open_config: failed to open configuration file /etc/frr//ripd.conf。
- Meaning: The specified protocol configuration file is missing or the path is incorrect; when this prompt appears while the protocol is not enabled, it can be considered non-fatal.
Log Level Description
- debug: Debug information, the most detailed.
- info/notice: Status and notifications, commonly used for operational monitoring.
- warn: Warning message, need to pay attention to possible issues.
- err: Error message, needs to be addressed promptly.
Troubleshooting Process
Define the time point
- Determine the specific time when the anomaly occurred, and review the logs within 1–3 minutes before and after that time; use "DOWNLOAD LOG" to export if necessary.
Module Hierarchical Analysis
- Physical/Link Layer: kernel, netifd (interface jitter, driver and media issues).
- Control plane: watchfrr, zebra, and various routing protocol daemons (neighbor session, configuration loading, authentication).
- Management and System: mgmtd, System Services (Configuration Files, Permissions, and Paths)
Establish a causal chain
- If the interface frequently goes Up/Down, first check the physical layer and wireless environment, then observe whether the routing session fluctuates accordingly.
- If only the protocol session is abnormal while the interface is stable, it is mostly due to configuration errors, unreachable neighbors, or VRF/source IP mismatch.